What’s going on with the US labor data?
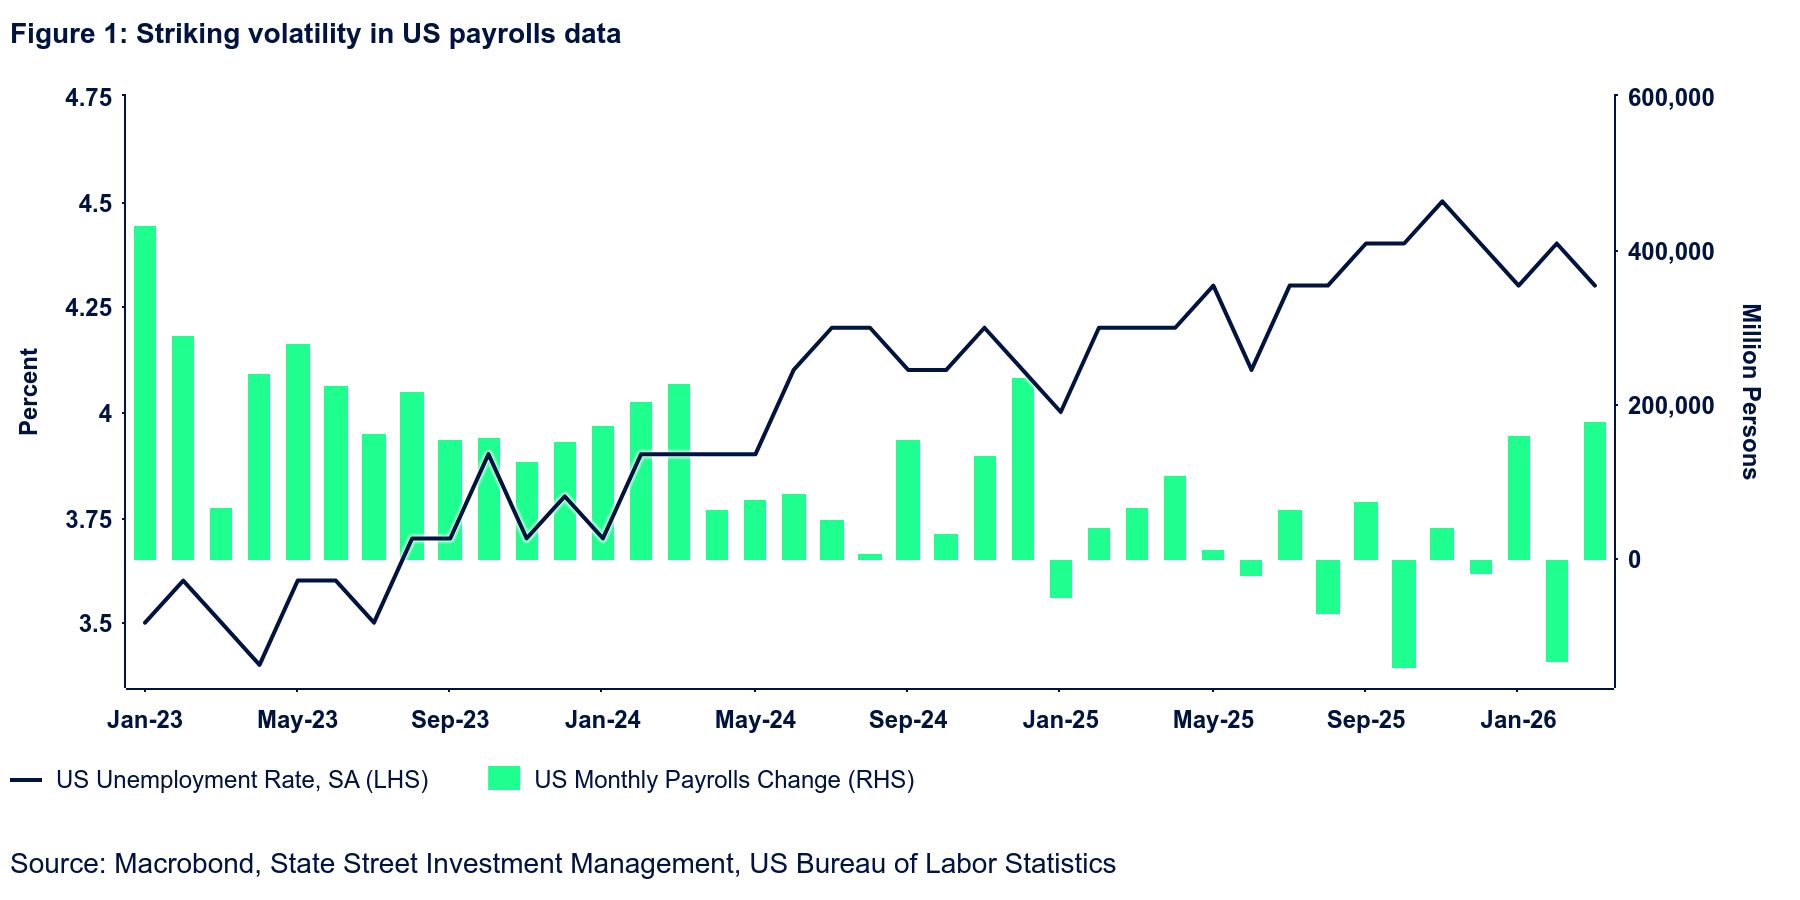
The US labor data appears to us increasingly perplexing. The striking volatility in monthly payrolls data over the last several months is hard to explain even in the context of the government shutdown, methodology adjustments, bad weather, and strike activity (Figure 1). It is highly unlikely, in our view, that the real economy truly exhibits these sizable shifts in employment, especially since other indicators do not suggest similar moves. It is therefore unwise to read too much into any single monthly report, and it is difficult to formulate a high-conviction view of where the trend is really taking us. We still lean towards the view that labor demand is soft yet acknowledge the fact that if positive surprises of the magnitude seen in January and March continue, that view might need revisiting. But we also remind ourselves (and our readers) that over the last fourteen months, we had exactly one positive payrolls revision; all the others have been negative. As such, we are not ready to “throw in the towel” just yet.
Let us acknowledge the surprisingly strong March employment report, however. Non-farm payrolls reportedly rose by 178k, far exceeding expectations and the best print in over a year. The wo-month net revision was a small negative (7k), but the revisions to the individual months themselves were substantial, with January revised up by 34k and February down by 41k.
As reported, job gains were broad across industries, with few exceptions being information, financial services, and government. But other elements of the report were considerably softer. For instance, the average workweek shrank by 18 minutes so, despite more people working, the aggregate hours index (a measure of work effort in the economy) declined 0.2% m/m. Wages were also on the softer side. Wage inflation as measured by average hourly earnings moderated 0.3 percentage points (ppts) to 3.5% for the full worker population and also by 0.3 ppt to 3.4% for production and non-supervisory employees. These marked respective lows for the two series since May 2021.
According to the household survey, employment declined by 64k and unemployment by a sizable 332k, meaning the labor force shrank by almost 400k people. This lowered the labor force participation rate by another tenth to 61.9%, the lowest since November 2021. The unemployment rate declined a tenth to 4.3% and almost rounded down to 4.2%. We are somewhat suspicious of the big, reported drop in unemployment, but it remains to be seen whether future updates will confirm it. For those who are unemployed, it is getting harder to get a job. The average duration of unemployment is 25.3 weeks, just marginally shorter than in February and (outside of Covid) the longest since November 2017. The median duration of 11.5 weeks is the longest since August 2015.