Mixed inflation data, more troubling labor data
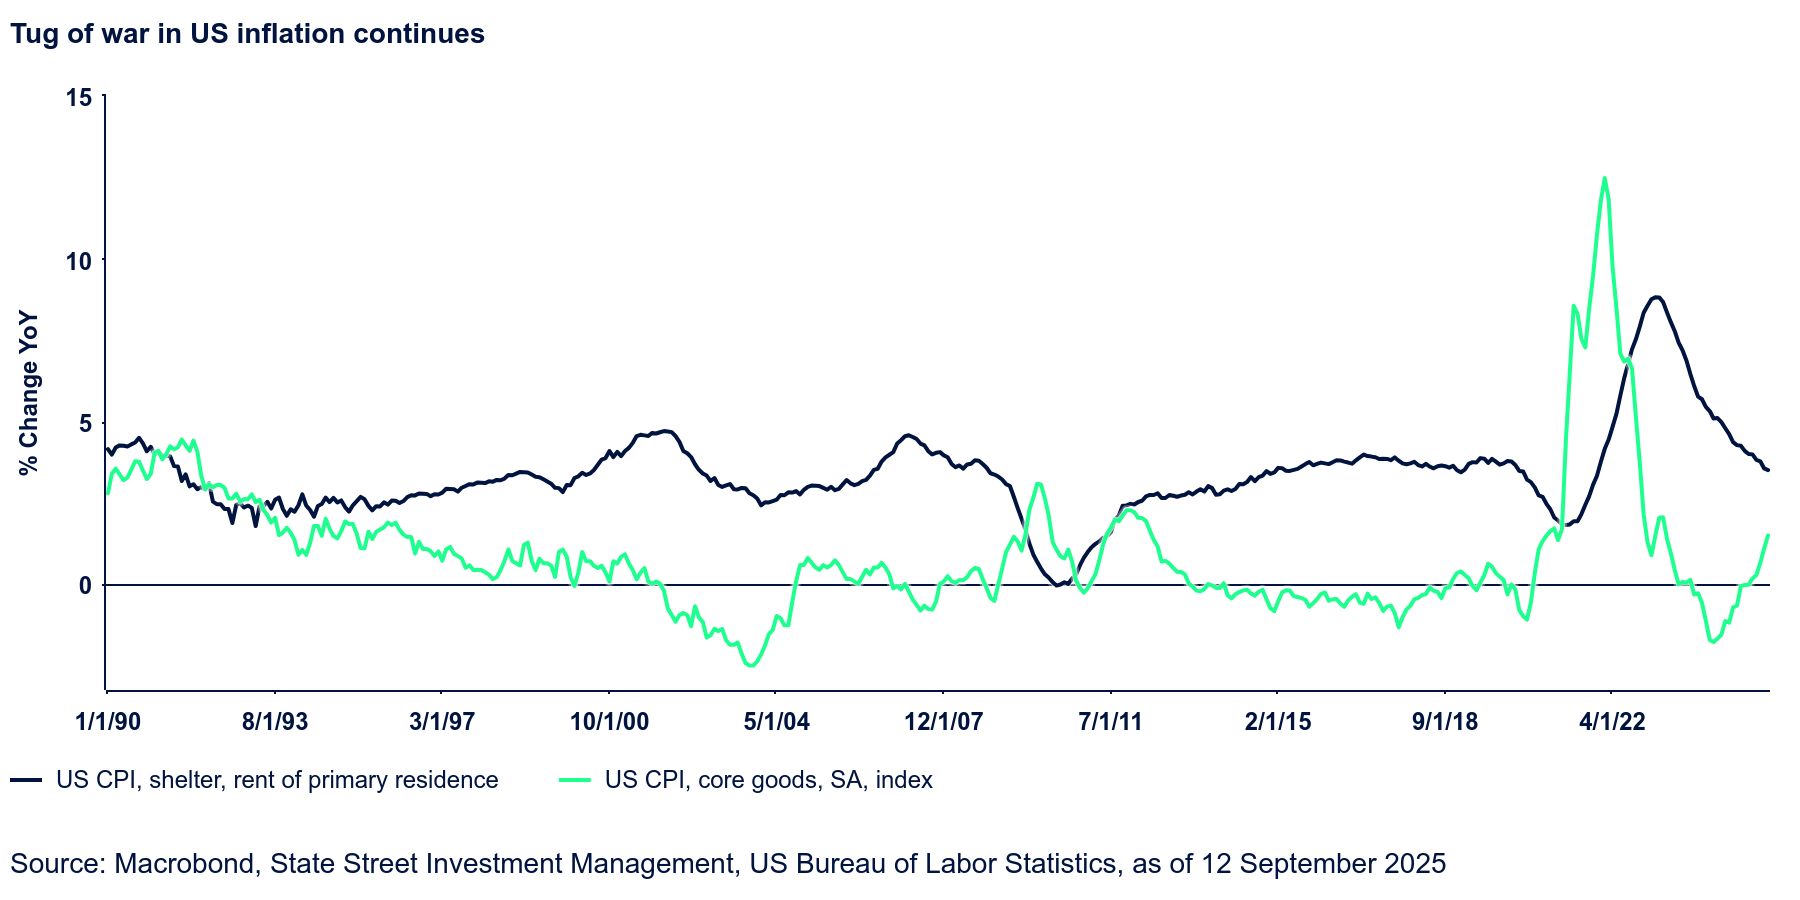
There was some relief around the August inflation data, with CPI inflation coming in largely as expected and PPI inflation surprising to the downside (a welcome development). Headline CPI inflation rose two tenths to 2.9% YoY, the highest since January—while core CPI inflation was steady at 3.1% YoY. The details were mixed, with surprising strength in shelter, though that was to some degree driven by hotel rates. Over the last couple of years, this component has exhibited occasional surges, but they have been followed (or preceded) by offsetting declines. We have no reason to believe this pattern has broken, so we are not overly concerned.
There was a big jump in the food at home category, which could become problematic if sustained. Beef and coffee experienced notable increases, hinting at tariff impacts. Food at home inflation jumped half a percentage point to 2.7% YoY, the highest since August 2023. It seems likely to cross the 3.0% mark—the question is how soon and by how much. On the bright side, there was a downside surprise in medical care services following the prior month’s surge, and recreation services were also soft. All in all, an acceptable report that nonetheless bears watching.
There was much clearer improvement in the producer price inflation (PPI) data, not least because this also entailed a moderate downward revision to the prior month’s data, which had surprised to the upside when initially reported. Goods prices rose 0.1% MoM (versus 0.6% in July) while service prices declined 0.2% (following July’s 0.7% jump that initially was reported as 1.1%). Goods PPI inflation rate is inching higher, though at 2.1% YoY does not look threatening. Services PPI inflation eased back to 2.9% YoY, which is the second-lowest print since July 2024.
Neither the CPI nor the PPI data should preclude a September Fed rate cut. In fact, as we mentioned in these pages last week, the labor market data is beginning to suggest that more aggressive cuts may be appropriate. We still hold to our forecast of 75 bp worth of cuts this year, but that could turn into 100 bp, depending on how much further deterioration we see from here.
The data that helped most in assessing the state of the labor market this week wasn’t a current release, but rather a preliminary estimate of the next benchmark revision, to be incorporated in payrolls data early next year. The BLS (Bureau of Labor Statistics) indicated that employment was 911,000 lower in the twelve months ending March 2025. In other words, the economy added 71k jobs per month between April 2024 and March 2025, not 147k as had been previously reported. Given that this occurred prior to any material changes in immigration policy, it suggests the cooling was overwhelmingly a reflection of weaker labor demand, not the result of labor supply disruptions. The post-revision data does appear to better align with other labor market indicators such as the quits rate, hours worked, and even wage inflation, all of which had for a while pointed to looser labor market conditions than the headline payrolls data seemed to suggest.
In light of these data, there is unquestionably more urgency for the Fed to act to prevent a deeper labor market deterioration. Slow hiring is still OK, but we do not wish to see it give way to outright firing.