Monthly Portfolio Statistics
June 30, 2026Market Commentary
Paid to Wait Amid Policy and Political Uncertainty
June was supposed to be a straightforward month for cash investors. The Federal Reserve was expected to sit still, money markets were behaving themselves, and summer was approaching. Naturally, markets looked at these perfectly reasonable expectations and decided to do something entirely different.
The month’s main event was the first FOMC meeting chaired by Kevin Warsh. The Fed left rates unchanged at 3.50–3.75%, exactly as everyone expected. In fact, expectations were so unanimous that a surprise would probably have caused several trading desks to collectively throw their spreadsheets out the window. Instead, Chair Warsh chose a different form of entertainment. He dramatically shortened the Fed statement, reduced forward guidance, announced a series of task forces reviewing everything from communication strategy to the balance sheet, and effectively told markets, “You’ll just have to watch the data and figure it out yourselves.”
For the last decade, investors had become accustomed to central bankers providing enough forward guidance to practically reveal next year’s Christmas presents. June marked a return to a more traditional approach: uncertainty. Markets reacted accordingly. Short-term treasury yields jumped, and traders began debating when, not if, rate hikes might actually happen. Nothing says “summer relaxation” quite like reviving discussions about monetary tightening.
Economic data didn’t help anyone seeking clarity. Payrolls remained strongish (June weaker than expected and May revised down), retail sales exceeded expectations, and much of the anticipated economic slowdown stubbornly refused to cooperate. A number of economists entered June predicting cuts, only to spend the second half of the month explaining why they might have accidentally discovered rate hikes instead. To be fair, forecasting central banks has always been somewhere between economics and interpretive dance.
Fortunately, cash investors had little reason to complain. Treasury bill yields moved to some of the most attractive levels seen in months. Three-month bills traded above 3.70% while six-month bills pushed above 3.90%. Investors responded by purchasing bills while simultaneously worrying that rates could move even higher. Credit markets were similar; opportunities were there but care was warranted. Markets can reprice fast and leave you with renewed risk. This is a time-honored tradition in the cash markets: finding an attractive yield and immediately becoming concerned that you’re not getting enough of it.
Money market funds also enjoyed another exceptional month. Assets climbed to a record near $7.9 trillion as investors continued parking cash in what has become one of the most popular trades on Wall Street: getting paid to be patient. Institutional investors alone added roughly $100 billion in a single week. After years of earning close to nothing on cash, investors remain surprisingly enthusiastic about earning something.
Meanwhile, the repo market spent June doing what repo markets do best: being incredibly important while remaining completely invisible to everyone outside of fixed income. Funding conditions remained orderly despite quarter-end pressures, Treasury settlements, corporate tax dates, and enough Treasury General Account discussions to test even the most committed money-market enthusiast. The Secured Overnight Financing Rate (SOFR) stayed well anchored, liquidity remained abundant, and funding markets continued functioning with all the drama of a suburban zoning meeting.
Of course, no 2026 market commentary would be complete without mentioning Iran, energy prices, and geopolitics. The Strait of Hormuz remained one of the most closely watched geopolitical flashpoints for inflation markets. Every headline regarding ceasefires, negotiations, or shipping routes seemed capable of moving oil prices, inflation expectations, Treasury yields, and occasionally investors’ blood pressure. By month-end, tentative progress toward reopening shipping routes helped calm markets somewhat, though confidence remained cautious. After all, investors had already learned several times this year that peace in the Middle East can be a very temporary concept.
Figure 1: Progression towards reopening the Straight of Hormuz alleviated pressure on energy prices
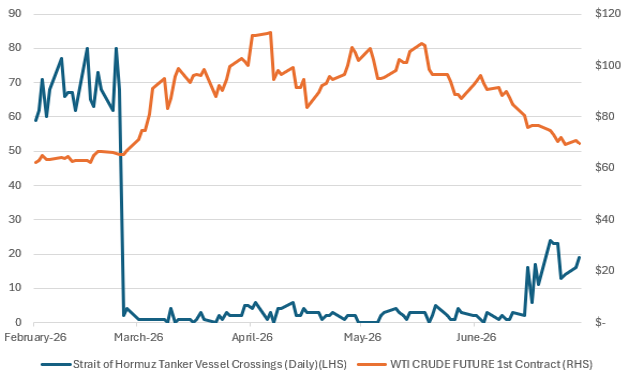
Source: Bloomberg, as of June 30, 2026
Equity investors had a more challenging month. Rising yields, fading expectations for rate cuts, and renewed debates about technology valuations produced occasional bouts of discomfort. It turns out that even AI stocks occasionally remember that interest rates exist. Who knew?
As June closes, the outlook for cash investors remains remarkably attractive. Yields are compelling, liquidity is plentiful, and funding markets remain stable. The future path of monetary policy may be less certain than it was a month ago, but money market investors are currently being paid handsomely to wait for the answer. In a world filled with geopolitical drama, policy uncertainty, and endless forecasting mistakes, earning nearly 4% while remaining liquid may be the closest thing markets offer to a free lunch. And unlike most free lunches, this one actually pays you.
Liquidity Fund
Over the month, the Caltrust Liquidity Fund experienced a decline in assets while continuing to maintain a conservative risk and liquidity profile. Total AUM decreased from $3.511 billion to $2.754 billion, representing a 21.6% decline. The fund’s yield increased modestly by 2 basis points to 3.77% month over month, supported by higher forward rates and fund redemptions. Market conditions continued to reflect adjustments to geopolitical risks, incoming inflation data, modest curve steepening, and marginally wider credit spreads. Issuers remained well funded, and liquidity in short-end markets continued to be sound. From an interest-rate positioning perspective, the portfolio remained broadly consistent over the month, with WAM increasing by 1 day to 51 days and WAL increasing by 2 days to 79 days. Floating-rate exposure declined slightly to approximately 21%, exposure to Yankee CDs remained stable at approximately 27%, commercial paper exposure increased modestly, and repurchase agreement exposure remained steady at 23.34%. Given stable repo rates, the fund reduced exposure across asset classes to fund redemptions and capture yield while preserving the overall maturity profile. Exposure to higher-rated credits increased by 1.43%. Overall liquidity remained robust, with daily and weekly liquidity ratios broadly stable, while 90-day liquidity declined modestly by 4.13% to 57.67%.
Key Statistics
| Portfolio | |
|---|---|
| WAM (Weighted Average Maturity) | 51.21 |
| WAL (Weighted Average Life) | 79.08 |
| Distribution Yield (%) | 3.75 |
| 30 Day SEC Yield (%) | 3.74 |
| 7 Day Yield (%) | 3.74 |
| 7 Day Liquidity | 34.35 |
| 90 Day Liquidity | 57.67 |
| Average Credit Quality (S&P) | A-1 |
| Floating Rate Bonds (%) | 21.04 |
Sector Allocation
Historical Performance (Net%)
Short Term Fund
In June 2026, the Short-Term Fund posted a gross total return of 0.18% with income return contributing 0.32% and price return contributing -0.14%. Income return was the largest driver of total return. Treasuries was the largest contributor to income return, returning 0.21% in income return, followed by IG Credit (0.04%), ABS (0.04%), and government related securities (0.01%). For price return, Treasuries was the largest contributor at -0.11%.
Key Statistics
| Portfolio | Benchmark | Difference | |
|---|---|---|---|
| Duration (yrs) | 0.74 | 0.54 | 0.20 |
| Distribution Yield (%) | 3.71 | N/A | - |
| 30 Day SEC Yield (%) | 3.92 | N/A | - |
| Yield to Maturity (%) | 4.03 | N/A | - |
| Spread Duration (yrs) | 0.19 | 0.14 | 0.05 |
| OAS (bps) | 7.00 | 10.52 | -3.52 |
| Wal to Worst (yrs) | 0.77 | 0.56 | 0.21 |
| Average Credit Quality (Mdy/S&P) | Aa2/AA | Aa2/AA | - |
| Floating Rate Bonds (%) | 4 | 5 | -2 |
Benchmark: BBG Short Term Govt/Corp Index
Sector Allocation
Monthly Total Return Contribution (Gross bps)
Historical Performance (Net %)
Medium Term Fund
In June 2026, the Medium-Term Fund posted a gross total return of 0.09% with income return contributing 0.35% and price return contributing -0.26%. Income return was the largest driver of total return. Treasuries was the largest contributor to income return, returning 0.24% in income return, followed by IG Credit (0.06%), ABS (0.04%) and government related securities (0.01%). For price return, Treasuries was the largest contributor at -0.21%. With a longer duration profile and more duration risk, the impact of rates increasing, due largely to growth optimism from AI and the new Fed Chair Kevin Warsh’s commitment to achieve the FOMC’s inflation 2% objective, was more acutely felt in the Medium-Term fund.
Key Statistics
| Portfolio | Benchmark | Difference | |
|---|---|---|---|
| Duration (yrs) | 2.13 | 1.83 | 0.30 |
| Distribution Yield (%) | 3.89 | N/A | - |
| 30 Day SEC Yield (%) | 4.12 | N/A | - |
| Yield to Maturity (%) | 4.22 | N/A | - |
| Spread Duration (yrs) | 0.41 | 0.44 | -0.03 |
| OAS (bps) | 9.41 | 6.25 | 3.16 |
| Wal to Worst (yrs) | 2.34 | 1.96 | 0.38 |
| Average Credit Quality (Mdy/S&P) | Aa2/AA | Aa2/AA | - |
| Floating Rate Bonds (%) | 3 | 5 | -3 |
Benchmark: ICE BoA Govt/Corp 1-3 yr (ex BBB)